Analytics Dashboard

  • Stav: Closed
  • Odměna: $500
  • Přijatých návrhů: 8
  • Vítěz: Serge755

Instrukce k soutěži

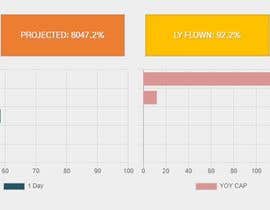
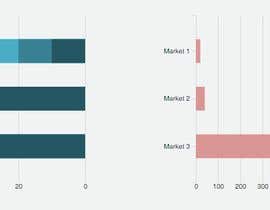
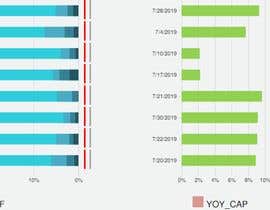
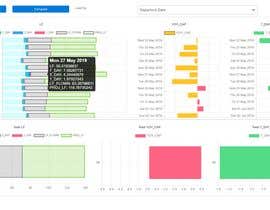
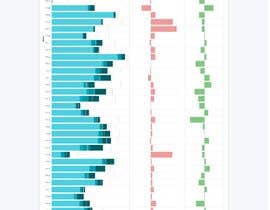
The project is to build an analytics dashboard in Java for a web page. The objective is to present the end user data in graphical format that is informational, color coded, and leads to better decision making. The charts are intended to condense a large amount of information into an easy to read actionable web page.
I have a general mock-up of how the data should be organized that is provided in the attached file. There is also a .json file that includes a sample of the data that will be used. The sample includes a date range of data from May-July. The final data set will be 4 times bigger.

Doporučené dovednosti

Zpětná vazba od zaměstnavatele

“Sergery is great to work with. He took my basic requirement and added his experience and knowledge to it which made the final project much better. ”

Profilový obrázek nealcyr, Ireland.

Nejlepší návrhy této soutěže

Zobrazit více příspěvků

Veřejná nástěnka k vyjasnění projektu

  • kosmos47
    kosmos47
    • Před 4 let

    Working on it, please wait for my entry

    • Před 4 let
    1. nealcyr
      Pořadatel soutěže
      • Před 4 let

      Will do, thank you.

      • Před 4 let
    2. kosmos47
      kosmos47
      • Před 4 let

      I've set a price for #13 in case you want something that looks different.

      • Před 4 let
  • ArnabDibosh
    ArnabDibosh
    • Před 4 let

    Hi,
    I have made some small ui modification and deployed again. Please check #15

    • Před 4 let
  • ArnabDibosh
    ArnabDibosh
    • Před 4 let

    Please check #15

    • Před 4 let
  • kosmos47
    kosmos47
    • Před 4 let

    #13

    • Před 4 let
  • pradeeppiet069
    pradeeppiet069
    • Před 4 let

    #6 https://bit.ly/2K7SQIU

    • Před 4 let
    1. pradeeppiet069
      pradeeppiet069
      • Před 4 let

      No sir you do not need to buy any thing

      • Před 4 let
    2. pradeeppiet069
      pradeeppiet069
      • Před 4 let

      Yes i know that .but the dashbord service is not third party its made by my team.the work which is completed by you 3 days we have a team which which works to make charts and dashboards we have automate the things on general purpose you made it for specific purpose

      • Před 4 let
  • ArnabDibosh
    ArnabDibosh
    • Před 4 let

    Hi Neal,
    Do you need a custom developed webpage? Or you want to use a dashboard service as Pradeep did?

    • Před 4 let
    1. pradeeppiet069
      pradeeppiet069
      • Před 4 let

      and we have many clients who uses the same so dont worry you will get best dashboard.

      • Před 4 let
    2. pradeeppiet069
      pradeeppiet069
      • Před 4 let

      like look on this we have many servers check dashboard here https://bit.ly/2Mejrq7

      • Před 4 let
  • pradeeppiet069
    pradeeppiet069
    • Před 4 let

    hi Please Check #1

    • Před 4 let
    1. pradeeppiet069
      pradeeppiet069
      • Před 4 let

      I have dashboard I can share you the URLs of that

      • Před 4 let
    2. pradeeppiet069
      pradeeppiet069
      • Před 4 let

      sir look on this url i have completed the dashboard https://bit.ly/2K7SQIU

      • Před 4 let
  • ArnabDibosh
    ArnabDibosh
    • Před 4 let

    Hi, Please check #4 . I have just build the skeleton. Now working on the rest of the dashboard. Hope to finish on time

    • Před 4 let
  • ksurat
    ksurat
    • Před 4 let

    What do you mean 'in Java'? Do you want us to you Java as the backend?

    • Před 4 let
    1. nealcyr
      Pořadatel soutěže
      • Před 4 let

      Hi Kristian, the backend is built separately. Data will be sent from the backend in .json to the frontend. That is what i need built.

      • Před 4 let
  • ArnabDibosh
    ArnabDibosh
    • Před 4 let

    Hi,
    I have seen the contest recently and started working. I have 3 years of professional experience in Analytics Dashboard development. So, hope to finish this properly.
    Can you please clarify few things:
    1. In the header LF and Projected LF are different. So, what is Projected LF?
    2. Why image file is the supported submission file type. Don’t you need a web page?
    3. Can we think of any better representation for Projected LF and LY Flown instead of vertical line? Clustered bar may look better. Example: https://exceljet.net/chart-type/clustered-bar-chart

    • Před 4 let
    1. ArnabDibosh
      ArnabDibosh
      • Před 4 let

      Regarding question 3-
      Should I build a webpage and give you the link? Or I should just submit the screenshot?

      • Před 4 let
    2. nealcyr
      Pořadatel soutěže
      • Před 4 let

      Hi Arnab, Both ways are acceptable. The webpage would be preferred.

      • Před 4 let
  • nealcyr
    Pořadatel soutěže
    • Před 4 let

    All, I have added an updated presentation, Presentation1_UPDATE. The previous file was missing the calculation for Proj_LF.

    • Před 4 let
  • alalfakawma
    alalfakawma
    • Před 4 let

    You mean JSP? Or do you mean Javascript? Is this only frontend code? Or we also have to setup the backend to supply the data with some kind of API?

    • Před 4 let
    1. nealcyr
      Pořadatel soutěže
      • Před 4 let

      Hi Aseem, this is only front-end. The back-end will be done separately.

      • Před 4 let
  • Rashedmallick
    Rashedmallick
    • Před 4 let

    Working, please wait up to the deadline.

    • Před 4 let
    1. nealcyr
      Pořadatel soutěže
      • Před 4 let

      Hi Rahsed, I can wait on the decision. How much time do you need?

      • Před 4 let

Zobrazit více komentářů

Jak začít se soutěžemi

  • Zadejte vaši soutěž

    Zveřejněte svou soutěž Rychlé a snadné

  • Získejte kupu návrhů

    Získejte spousty návrhů Z celého světa

  • Zvolte nejlepší návrh

    Zvolte nejlepší návrh Stáhněte si soubory - Je to snadné!

Zadejte soutěž nyní nebo se k nám připjte ještě dnes!